Data sourced from SnapStats Publishing.
Below is the price analysis for August 2019. It includes detailed information on detached homes, attached condos and townhomes. Check out the current market trends in New Westminster!
August Market Update for New Westminster
Below is the price analysis for August 2019. It includes detailed information on detached homes, attached condos and townhomes. Check out the current market trends in New Westminster!
Market Summary
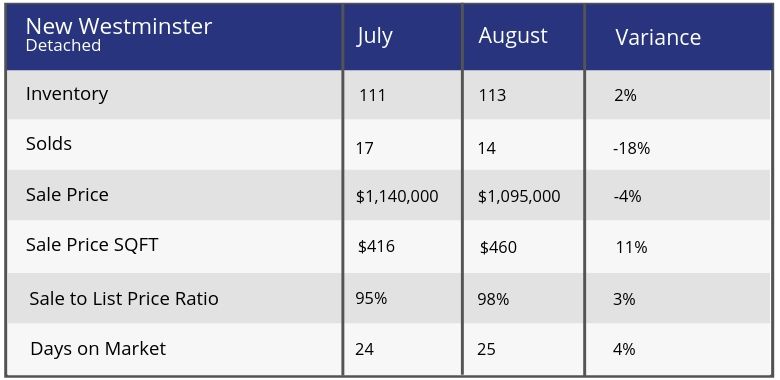
DETACHED- Balanced Market at 12% Sales Ratio average (1.2 in 10 homes selling rate)
- Homes are selling on average 2% below list price
- Most Active Price Band** $1 mil to $1.25 mil with average 19% Sales Ratio (Balanced market)
- Buyers Best Bet** Homes between $1.5 mil to $1.75 mil, West End, and minimum 5 bedroom properties
- Sellers Best Bet** Selling homes in The Heights and up to 2 bedroom properties
Market Summary
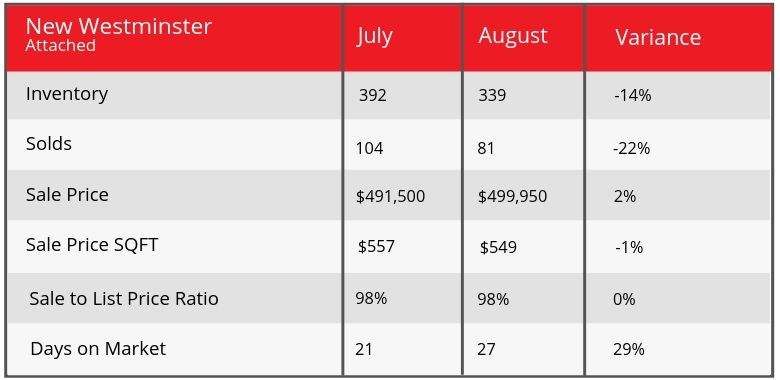
ATTACHED- Sellers Market at 24% Sales Ratio average (2.4 in 10 homes selling rate)
- Homes are selling on average 2% below list price
- Most Active Price Band** $300,000 to $400,000 with average 41% Sales Ratio (Sellers market)
- Buyers Best Bet** Homes between $700,000 to $800,000, Queensborough and 3 bedroom properties
- Sellers Best Bet* Selling homes in Fraserview, Quay and up to 1 bedroom properties