August Market Update for New Westminster
Below is the price comparison for New Westminster Houses and Condos for August 2021. View sales ratio average, most active price band, sellers and buyer’s best bet homes, neighbourhoods and properties.
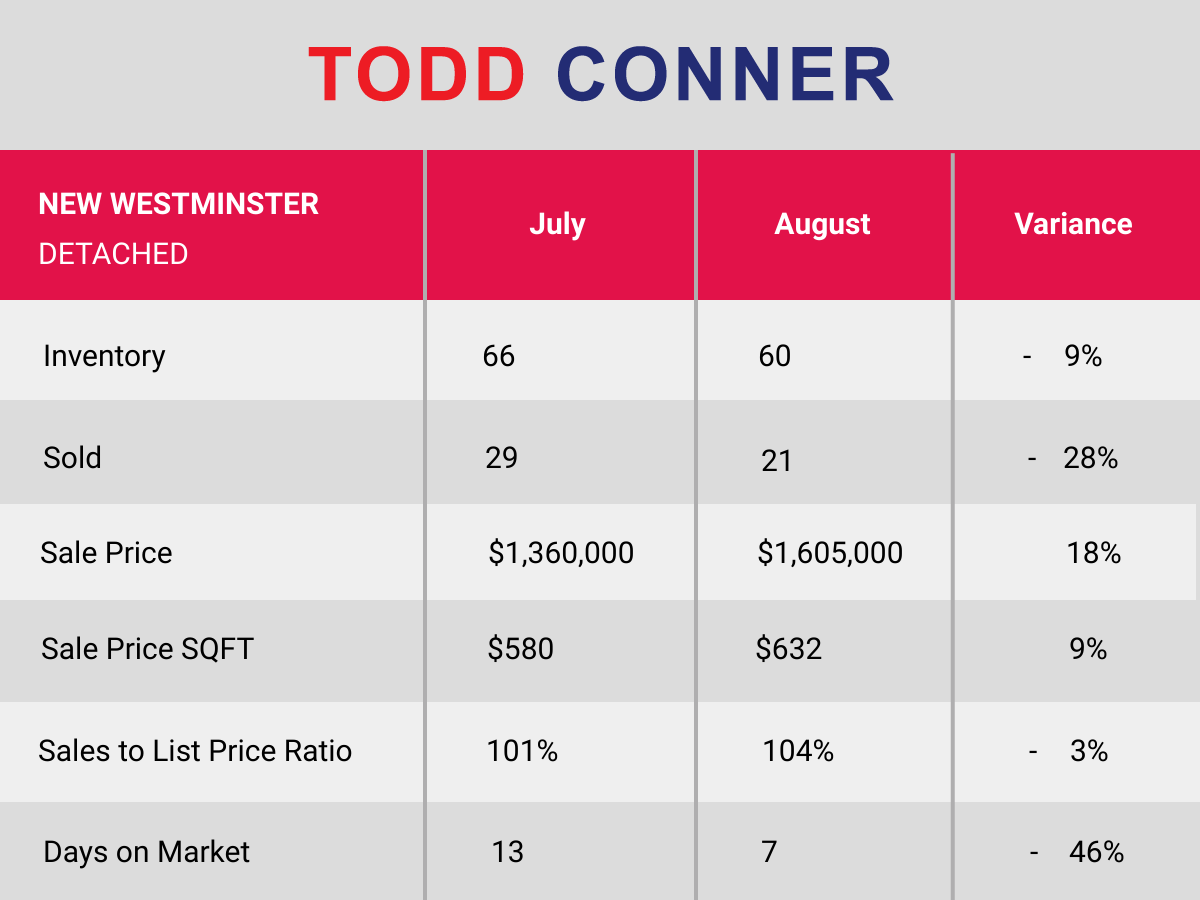
Market Summary DETACHED
- Market Type Indicator NEW WESTMINSTER DETACHED: Sellers Market at 35% Sales Ratio average (3.5 in 10 homes selling rate)
- Homes are selling on average 4% above list price
- Most Active Price Band** $1.5 mil to $1.75 mil with average 63% Sales Ratio (Sellers market)
- Buyers Best Bet** Homes between $1.25 mil to $1.5 mil, Queensborough and up to 2 bedroom properties
- Sellers Best Bet** Selling homes in The Heights and 3 to 4 bedroom properties
**With minimum inventory of 10 in most instances
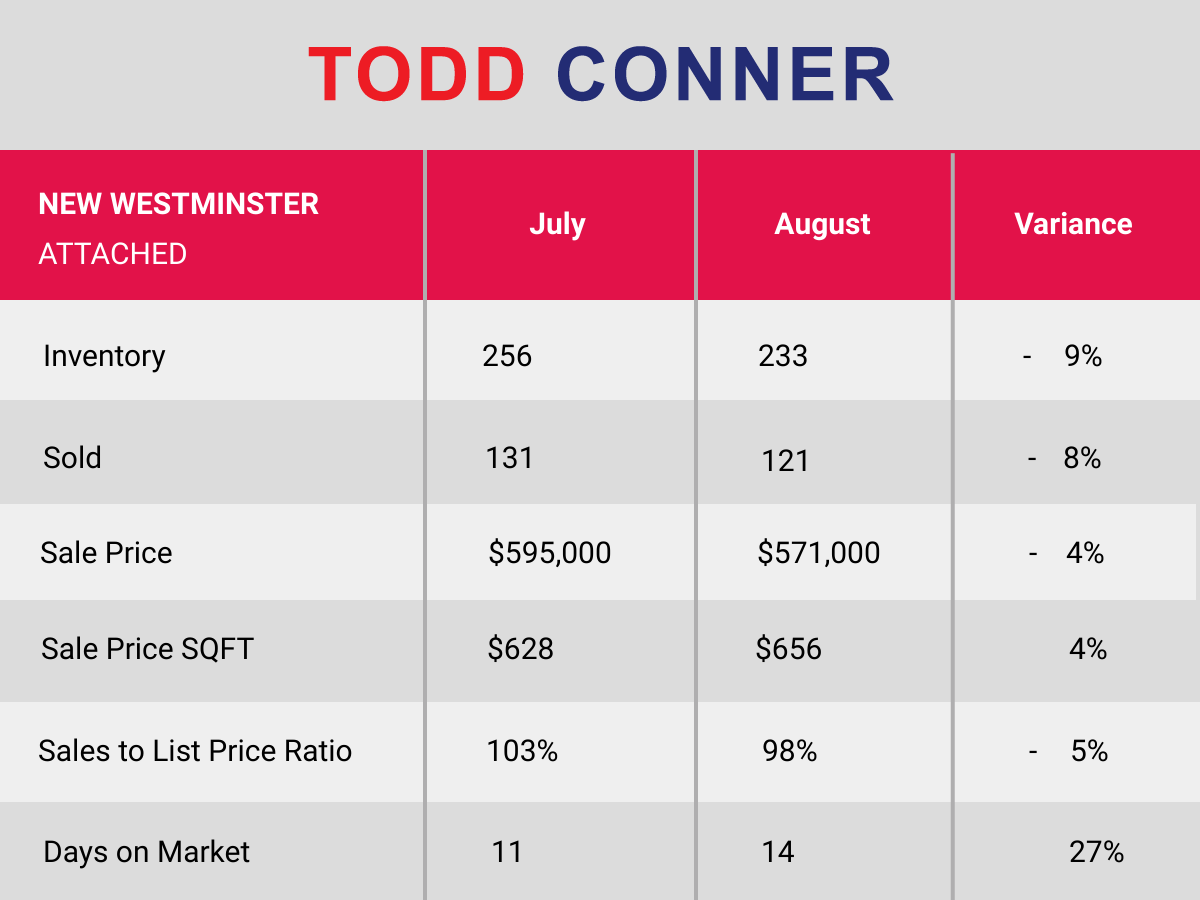
Market Summary ATTACHED
- Market Type Indicator NEW WESTMINSTER ATTACHED: Sellers Market at 52% Sales Ratio average (5.2 in 10 homes selling rate)
- Homes are selling on average 1% below list price
- Most Active Price Band** $300,000 to $400,000 with average >100% Sales Ratio (Sellers market)
- Buyers Best Bet** Homes between $1 mil to $1.25 mil, Quay and 2 bedroom properties
- Sellers Best Bet** Selling homes in Queensborough, Sapperton and up to 1 bedroom properties
**With minimum inventory of 10 in most instances
Data sourced from SnapStats Publishing.
August Market Update for Metro Vancouver
Download the PDF for a price analysis for Metro Vancouver in August 2021. Detailed information on detached homes, attached condos and townhomes are available!
Download Now
Do you want to get more detailed information?
Subscribe now to receive the full reports on the market trends from Greater Vancouver and Metro Vancouver!
Subscribe Now