Data sourced from SnapStats Publishing.
March Market Update for New Westminster
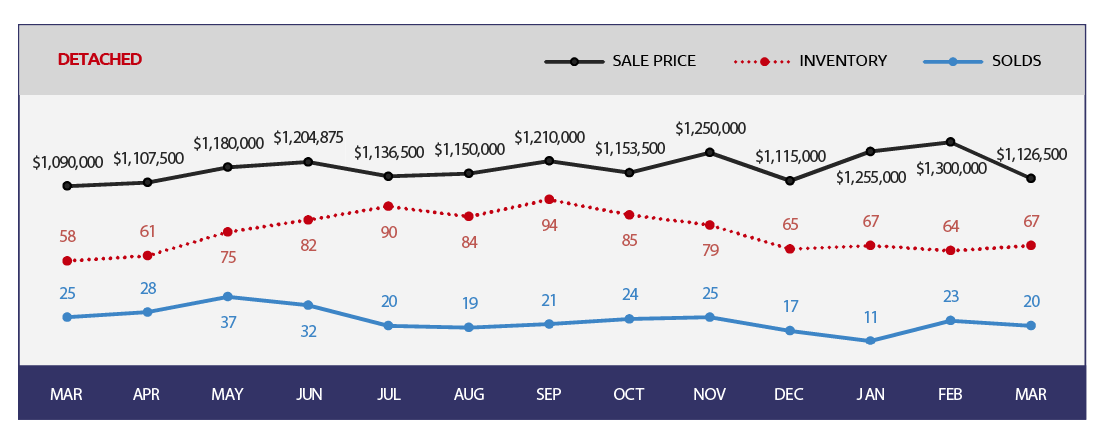
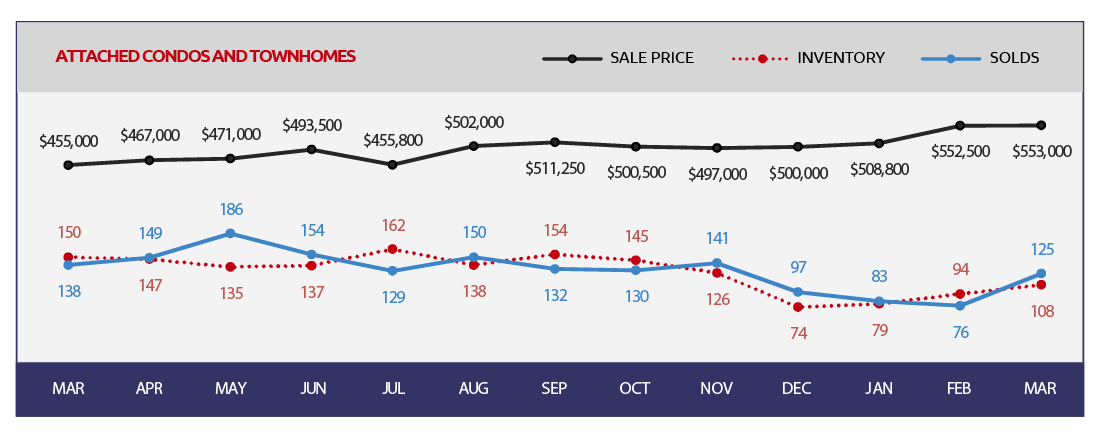
Below is the price analysis for March 2018. It includes detailed information on detached homes, attached condos and townhomes. Check out the current market trends in New Westminster!Market Summary
DETACHED- Sellers market at 30% Sales Ratio average (3 in 10 homes selling rate)
- Homes are selling on average 2% below list price
- Most Active Price Band** $1 mil to $1.25 mil with average 53% Sales Ratio (Sellers market speed)
- Buyers Best Bet** Homes between $1.25 mil to $1.5 mil, Sapperton, West End and 5 to 6 bedroom properties
- Sellers Best Bet** Homes in Queensborough, The Heights and 3 to 4 bedroom properties
Market Summary
ATTACHED- Sellers market at >100% Sales Ratio average (10 in 10 homes selling rate)
- Homes are selling on average 4% above list price
- Most Active Price Band** $300k to $600k and $700K to $800k with average >100% Sales Ratio (Sellers market speed)
- Buyers Best Bet** Homes between $800,000 to $900,000, Queensborough and 2 bedroom properties
- Sellers Best Bet” Homes in Downtown, Fraserview, Quay, Uptown and up to 1 bedroom 3 bedroom properties
Do you want to get more detailed information?
Subscribe now to receive the full reports on the market trends from Greater Vancouver and Metro Vancouver!”
Sign in
Create Account
Reset Password
Send Email Confirmation
Save Search
×
Hello!
Click one of our representatives below to chat on WhatsApp or send us an email to info@toddconner.com