Data sourced from SnapStats Publishing.
November Market Update for New Westminster
Below is the price analysis for November 2018. It includes detailed information on detached homes, attached condos and townhomes. Check out the current market trends in New Westminster!Market Summary
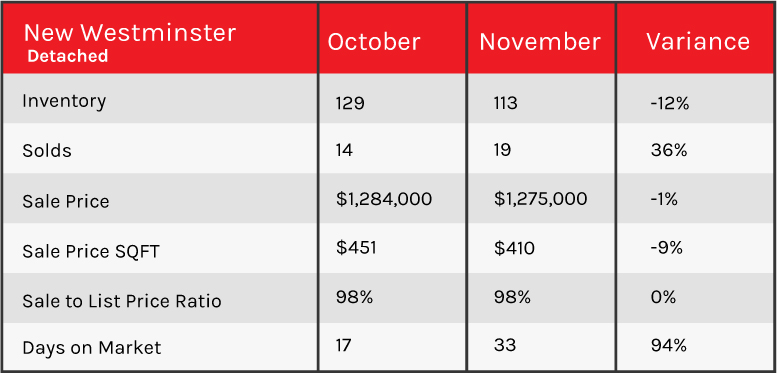
DETACHED- Balanced Market at 17% Sales Ratio average (1.7 in 10 homes selling rate)
- Homes are selling on average 2% below list price
- Most Active Price Band** $1 mil to $1.25 mil with average 23% Sales Ratio (Sellers market)
- Buyers Best Bet** Homes between $1.5 mil to $2 mil, Queensborough, Sapperton and minimum 7 bedroom properties
- Sellers Best Bet** Selling homes in Queens Park, The Heights, West End and 5 to 6 bedroom properties
Market Summary
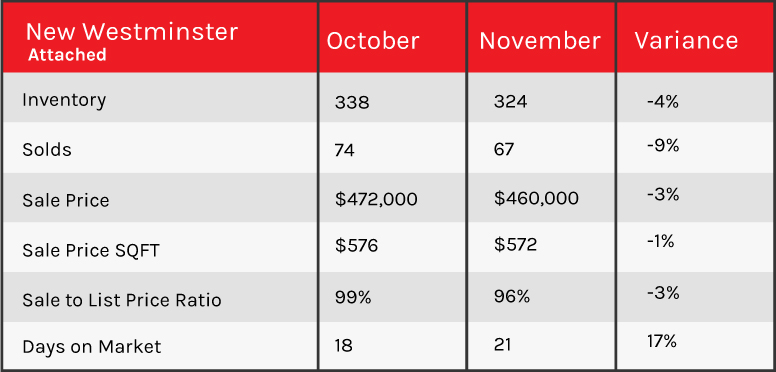
ATTACHED- Sellers Market at 21% Sales Ratio average (2.1 in 10 homes selling rate)
- Homes are selling on average 4% below list price
- Most Active Price Band** $300,000 to $400,000 with average 68% Sales Ratio (Sellers market)
- Buyers Best Bet** Homes between $700,000 to $800,000, Quay, Queensborough, Sapperton and 3 bedroom properties
- Sellers Best Bet* Selling homes in Glenbrooke North and up to 1 bedroom properties