May Market Update
This is the price analysis for the month of May 2017. It includes detailed information on detached homes, attached condos and townhomes. Take a look at the current market trends!
Market Summary
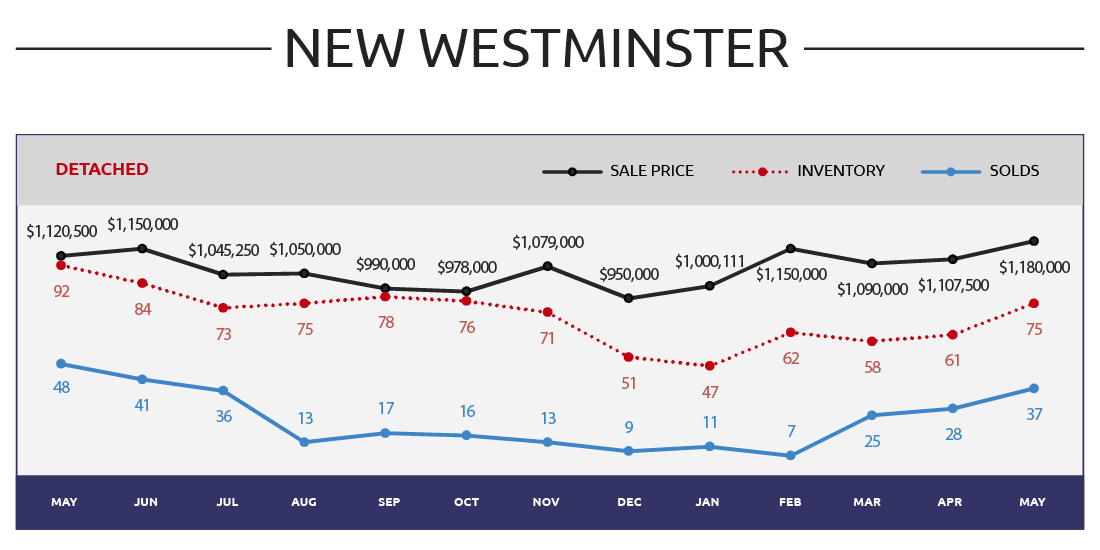
- Official Market Type NEW WESTMINSTER DETACHED: Sellers market at 49% Sales Ratio average (4.9 in 10 homes selling rate)
- Homes are selling on average 2% below list price
- Most Active Price Band**$1 mil to $1.25 mil with average 70% Sales Ratio (Sellers market)
- Buyers BestBet**Homes between $1.25 mil to $1.5 m il,Queens Park,The Heights and 5 to 6 bedroom properties
- Sellers BestBet**Homes in WestEnd and 3 to 4 bedroom properties
Market Summary
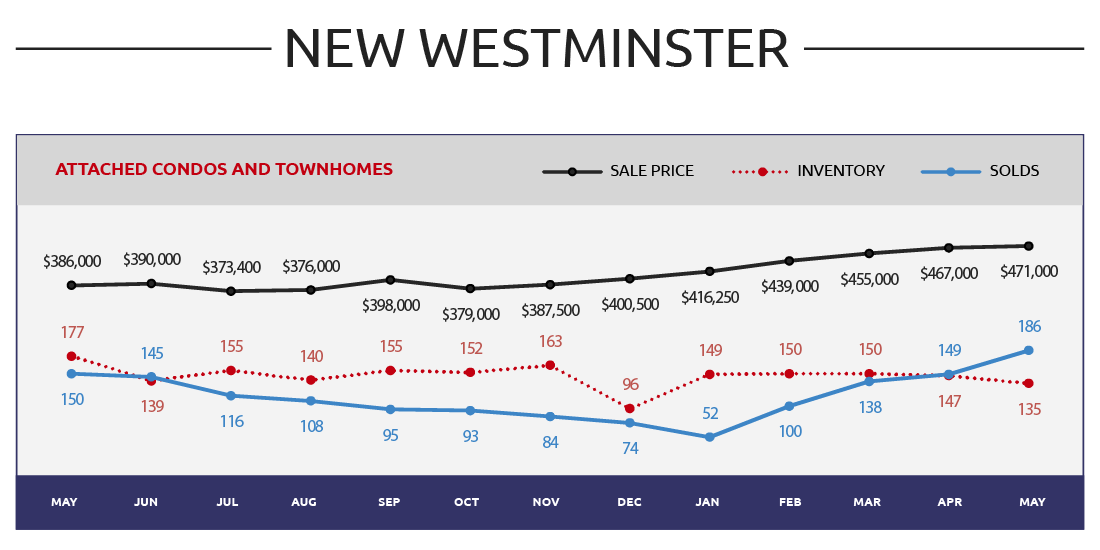
- Official Market Type NEW WESTM INSTER ATTACHED:Sellers market at>100% Sales Ratio average (10 in 10 homes selling rate)
- Homes are selling on average 6% above list price
- Most Active Price Band**$200,000 to $500,000 and $600,000 to $800,000 with average >100% Sales Ratio (Sellers market)
- Buyers BestBet**Homes between $500,000 to $600,000, Queensborough and 3 bedroom properties
- Sellers BestBet**Homes in Downtown, Fraserview, Quay, Sapperton, Uptown and up to 2 bedroom properties
Market Summary
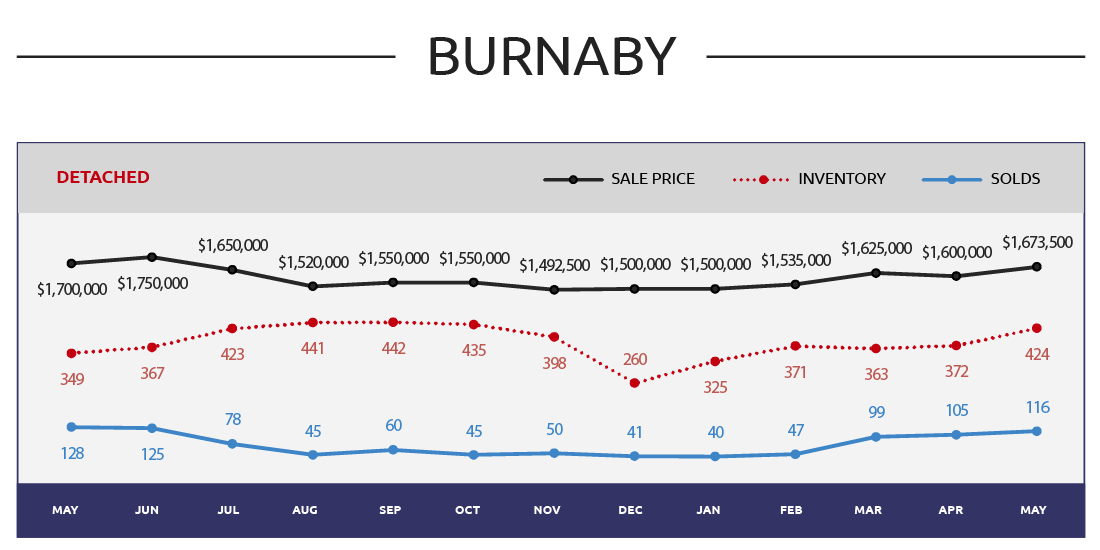
- Official Market Type BURNABY DETACHED:Sellers market at 27% Sales Ratio average (2.7 in 10 homes selling rate)
- Homes are selling on average 1% below list price
- Most Active Price Band**$1.25 mil to $1.75 mil with average 42% Sales Ratio (Sellers market)
- Buyers BestBet**Homes between $3 mil to $3.5 mil, Simon Fraser University, Westridge and minimum 5 bedroom properties
- Sellers BestBet**Selling homes in Government Road, Montecito, Sperling-Duthie, The Crestand 3 to 4 bedroom properties
Market Summary
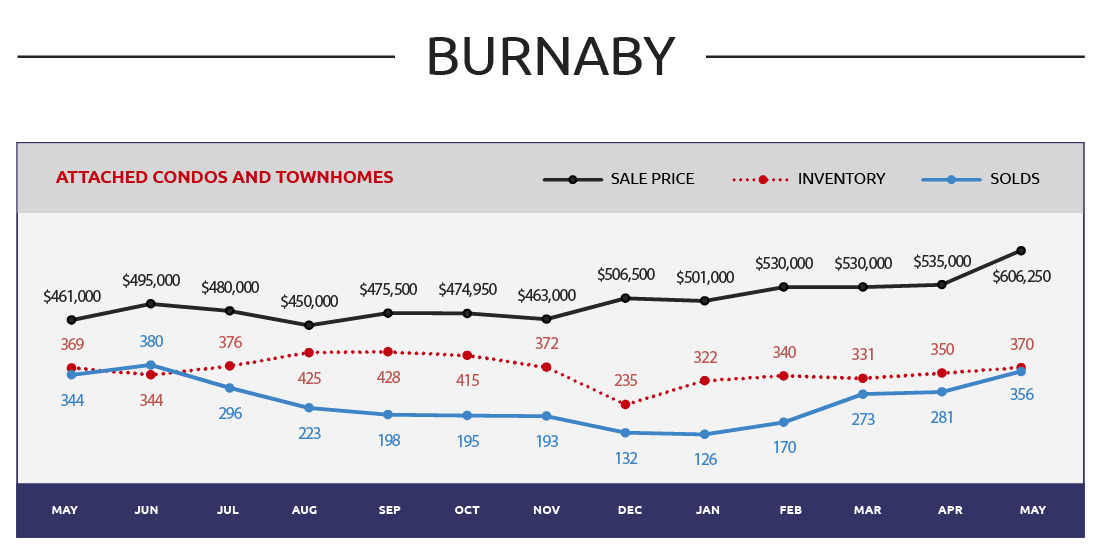
- Official Market Type BURNABY ATTACHED:Sellers market at 96% Sales Ratio average (9.6 in 10 homes selling rate)
- Homes are selling on average 3% above list price
- Most Active Price Band**$600,000 to $900,000 with average >100% Sales Ratio (Sellers market)
- Buyers BestBet**Homes between $1 mil to $1.25 mil, Edmonds, Simon Fraser University, Sullivan Heights and 4 plus bedrooms
- Sellers BestBet**Selling homes in Brentwood Park, Central, Highgate, Metrotown, South Slope and 3 bedroom properties
Market Summary
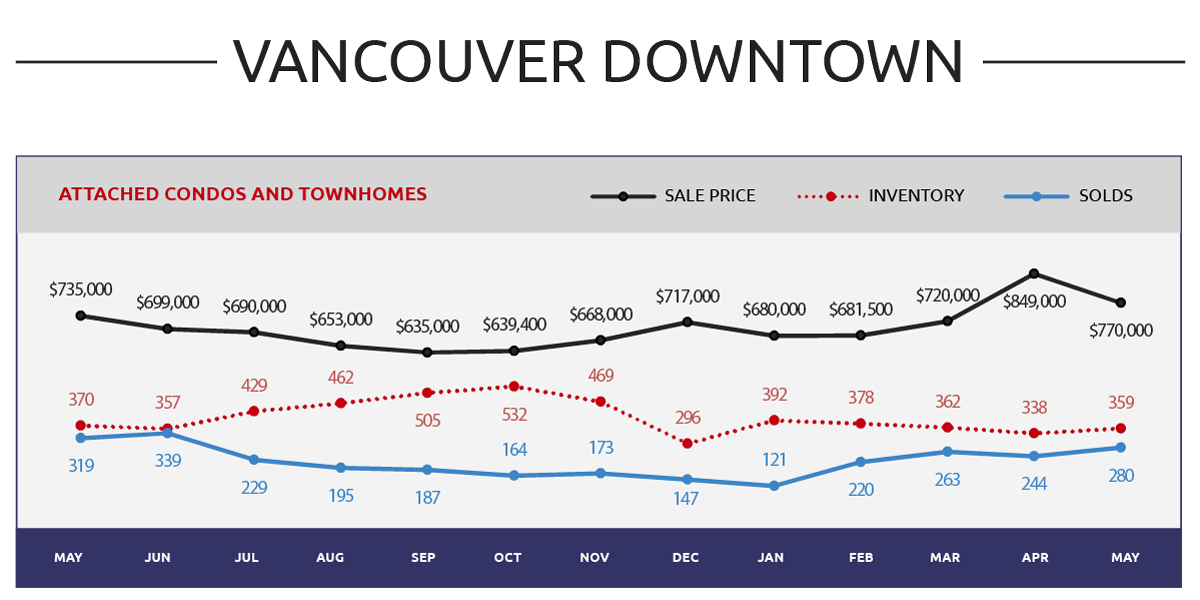
- Official Market Type DOWNTOWN: Sellers market at 78% Sales Ratio average (7.8 in 10 homes selling rate)
- Homes are selling on average at list price
- Most Active Price Band** +/- $1 mil: $400k to $700k (>100% Sales Ratio) / $1.5 mil to $1.75 mil (>100% Sales Ratio)
- Buyers Best Bet** +/- $1 mil: Homes between $900k to $1 mil / $1.75 mil to $2 mil plus, Yaletown and 3 bedroom properties
- Sellers Best Bet** Selling homes in Downtown and up to 1 bedroom properties
Market Summary
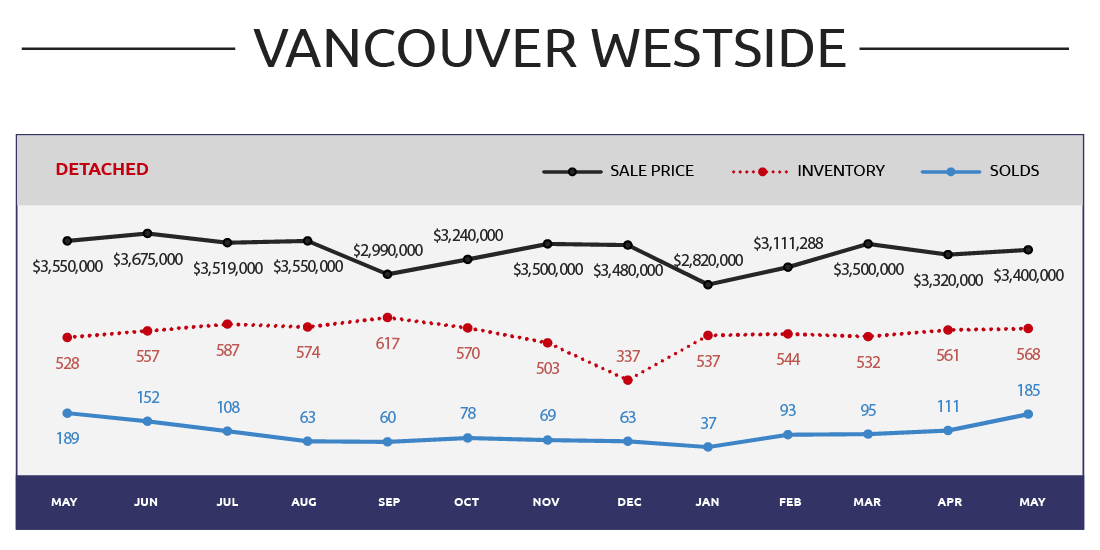
- Official Market Type WESTSIDE DETACHED: Sellers market at 33% Sales Ratio average (1 in 3 homes selling rate)
- Homes are selling on average 1% below list price
- Most Active Price Band** +/-$3 mil: $2 mil to $2.25 mil (>100% Sales Ratio) / $3 mil to $3.5 mil (67% Sales Ratio)
- Buyers Best Bet** +/-$3 mil: $2.75 mil to $3 mil / $5 mil plus, Shaughnessy, South Granville, University and 7 plus bedrooms
- Sellers Best Bet** Selling homes in Arbutus, Cambie, Kitsilano and 3 to 4 bedroom propertie
Market Summary
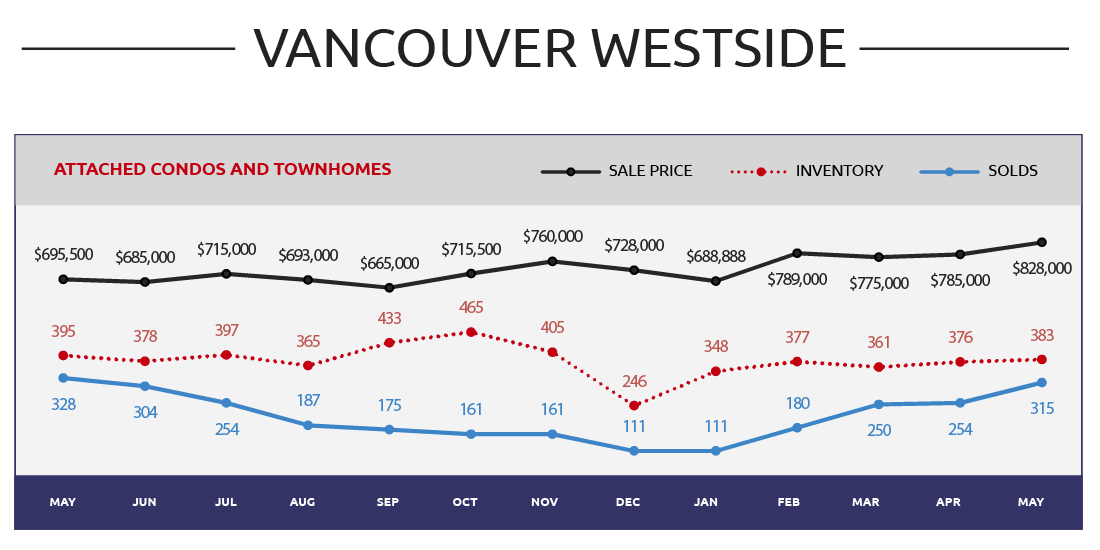
- Official Market Type WESTSIDE ATTACHED: Sellers market at 82% Sales Ratio average (8.2 in 10 homes selling rate)
- Homes are selling on average 4% above list price
- Most Active Price Band** $500,000 to $900,000 with average >100% Sales Ratio (Sellers market)
- Buyers Best Bet** Homes between $2.75 mil to $3 mil, South Granville and minimum 4 bedroom properties
- Sellers Best Bet** Selling homes in Fairview, Falsecreek, Kerrisdale, Kitsilano and up to 1 bedroom properties
Market Summary
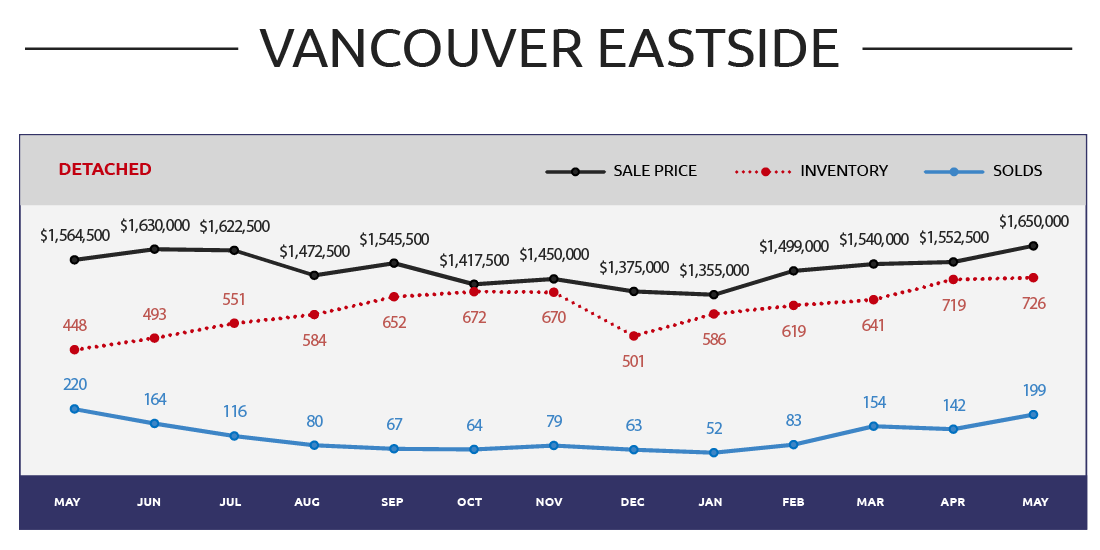
- Official Market Type EASTSIDE DETACHED: Sellers market at 27% Sales Ratio average (2.7 in 10 homes selling rate)
- Homes are selling on average 3% above list price
- Most Active Price Band** $1 mil to $1.25 mil with average 76% Sales Ratio (Sellers market)
- Buyers Best Bet** Homes between $2.5 mil to $2.75 mil, Collingwood, Fraserview, Renfrew and minimum 7 plus bedrooms
- Sellers Best Bet** Selling homes in Fraser, Knight, Mount Pleasant and up to 2 bedroom properties
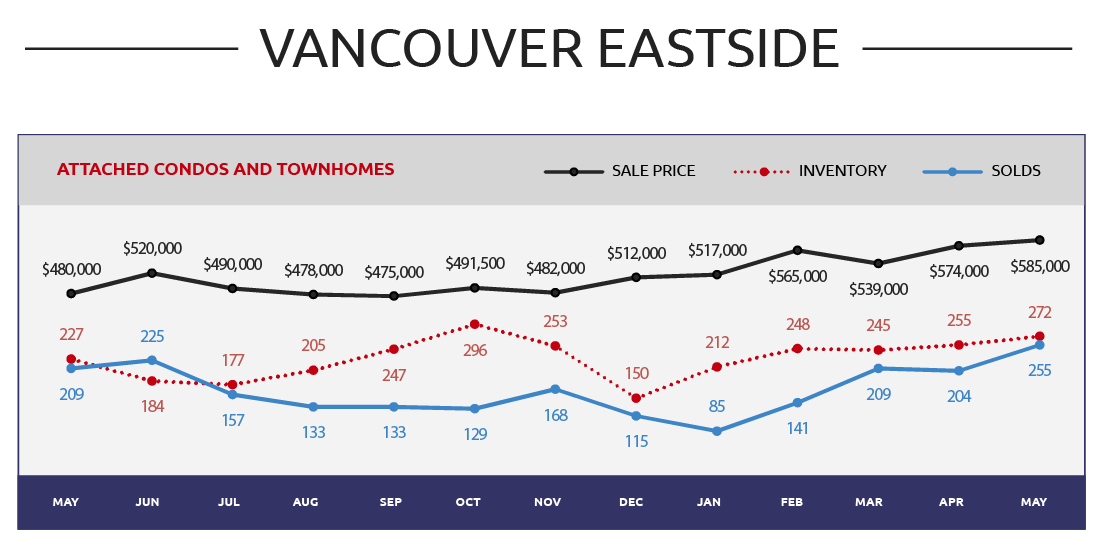
Market Summary
- Official Market Type EASTSIDE ATTACHED: Sellers market at 94% Sales Ratio average (9.4 in 10 homes selling rate)
- Homes are selling on average 6% above list price
- Most Active Price Band** $0 to $300,000 with average >100% Sales Ratio (Sellers market)
- Buyers Best Bet** Homes between $1.25 mil to $1.5 mil, Killarney, Victoria and 3 bedroom properties
- Sellers Best Bet** Selling homes in Grandview, Hastings, Mt Pleasant, Renfrew and up to 1 bedroom properties
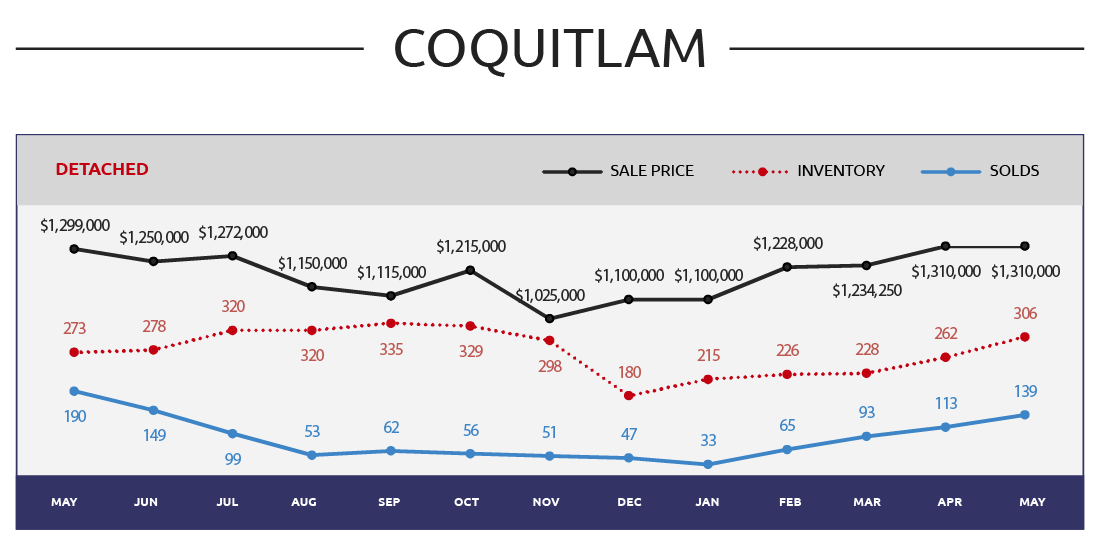
Market Summary
- Official Market Type COQUITLAM DETACHED:Sellers market at 45% Sales Ratio average (4.5 in 10 homes selling rate)
- Homes are selling on average at1% above list price
- Most Active Price Band**$800,000 to $900,000 with average >100% Sales Ratio (Sellers market)
- Buyers BestBet**Homes between $2.25 mil to $2.75 m il,HarbourChines,HarbourPlace, Maillardville and up to 2 bedrooms
- Sellers BestBet**Selling homes in Coquitlam East,Ranch Park and 3 to 4 bedroom properties
**With a minimum inventory of 10 in most instances
Do you want to get more detailed information?
Subscribe now to receive the full reports on the market trends from Greater Vancouver and Metro Vancouver!