July Market Update for New Westminster
Below is the price comparison for New Westminster Houses and Condos for July 2022. View sales ratio average, most active price band, sellers and buyer’s best bet homes, neighbourhood and properties.
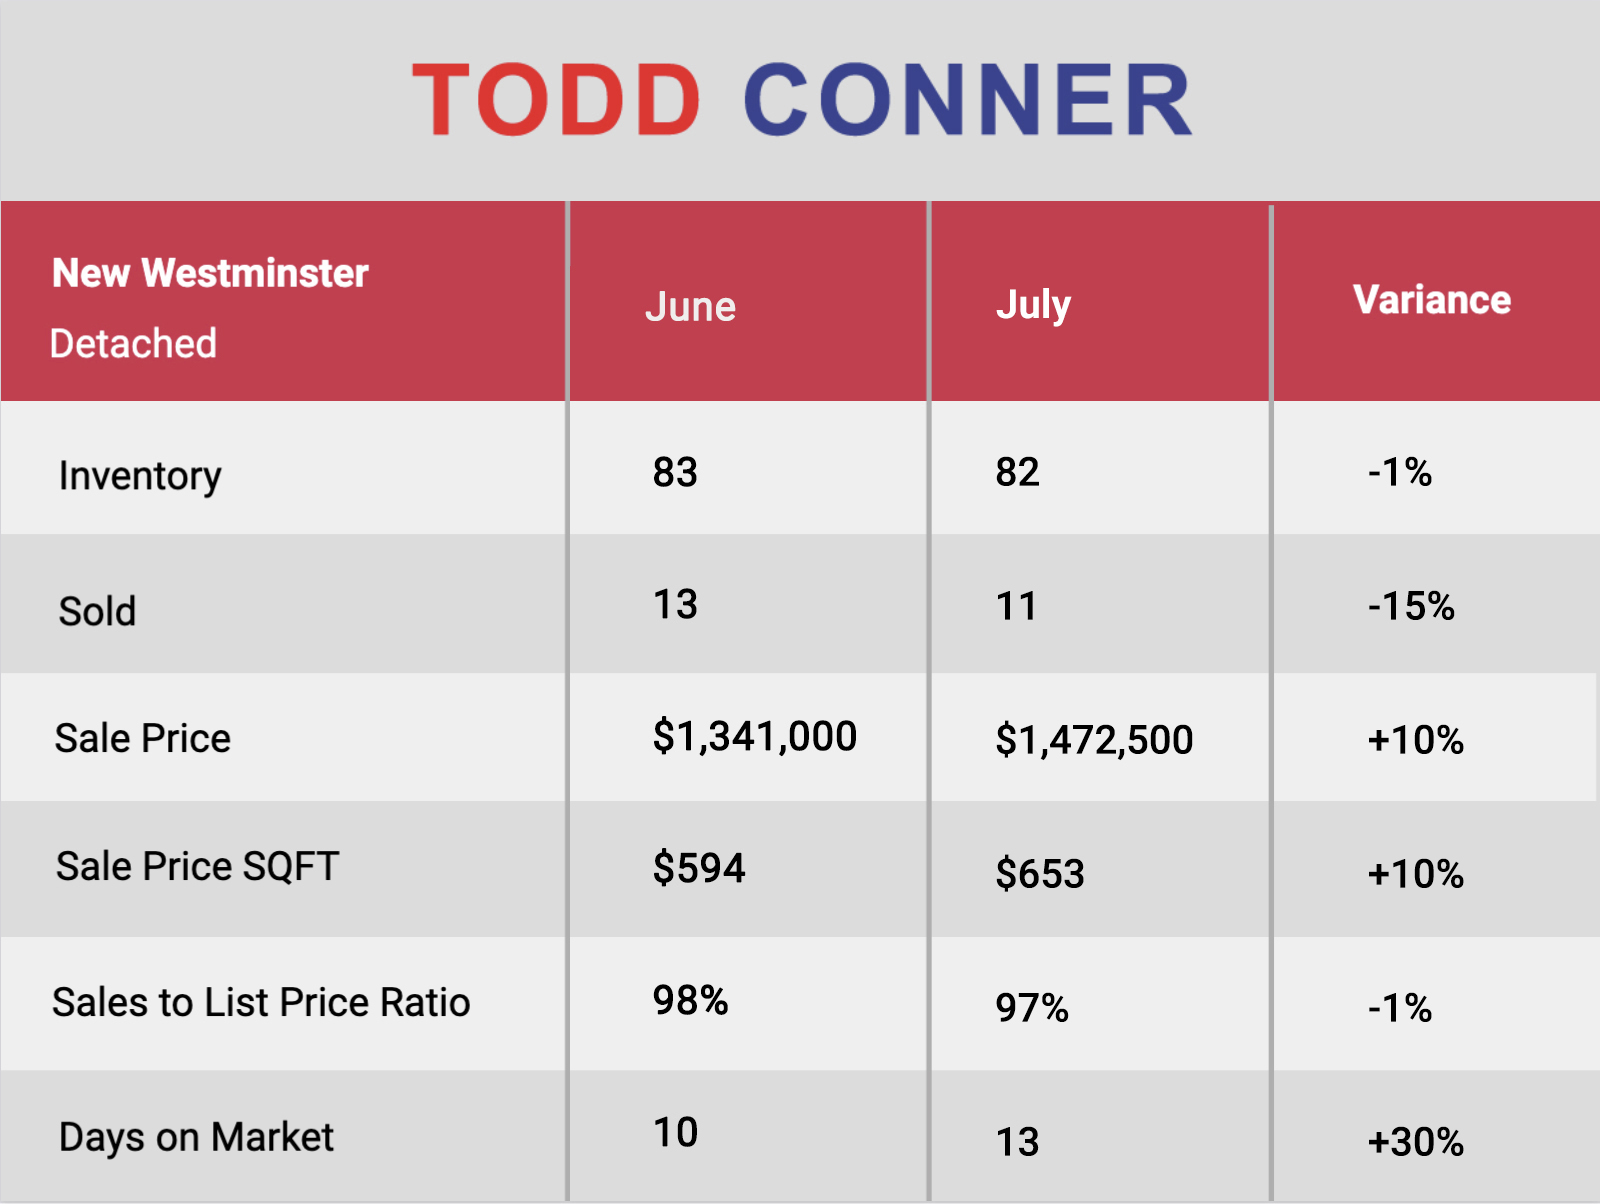
Market Summary DETACHED
- Market Type Indicator NEW WESTMINSTER DETACHED: Balanced Market at 13% Sales Ratio average (1.3 in 10 homes selling rate)
- Homes are selling on average 3% below list price
- Most Active Price Band** $1.25 mil to $1.5 mil with average 18% Sales Ratio (Balanced market)
- Buyers Best Bet** Homes between $2.25 mil to $2.5 mil, Queensborough, The Heights and up to 2 bedroom properties
- Sellers Best Bet** Selling homes in West End and 3 to 4 bedroom properties
**With minimum inventoryof10 in most instances
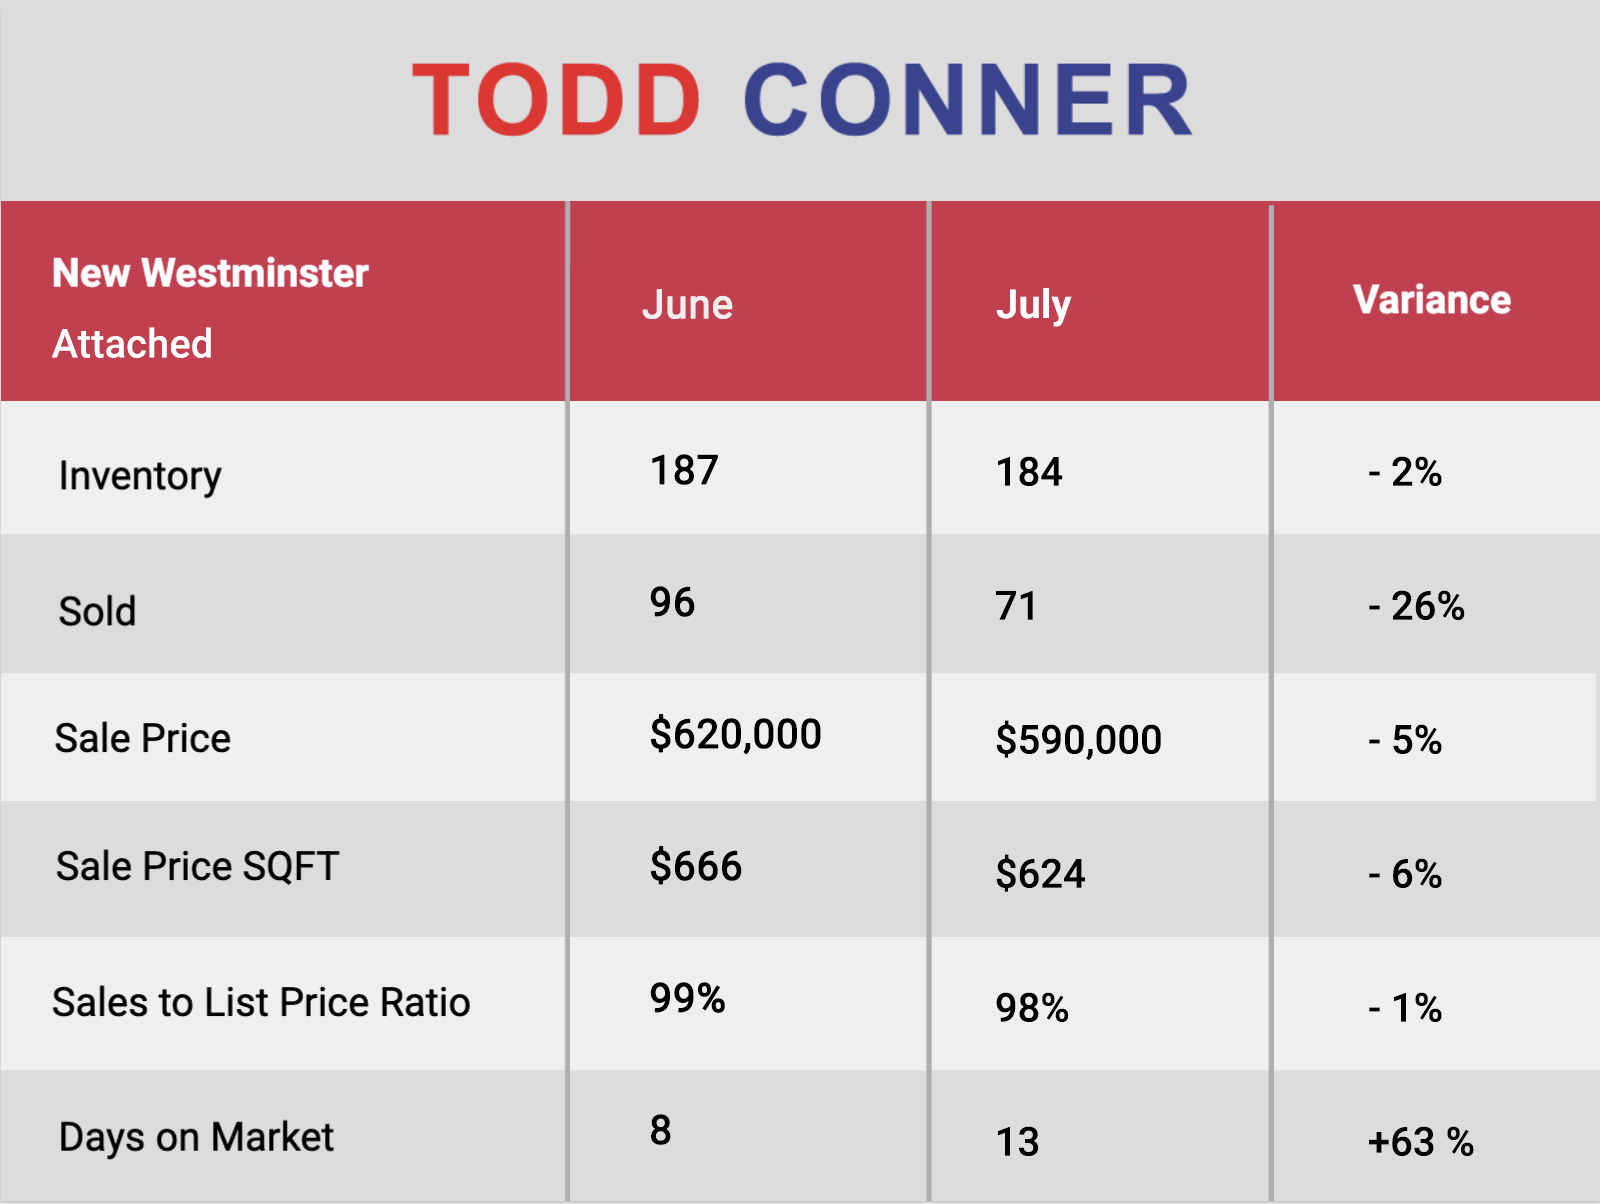
Market Summary ATTACHED
- Market Type Indicator NEW WESTMINSTER ATTACHED: Sellers Market at 39% Sales Ratio average (3.9 in 10 homes selling rate)
- Homes are selling on average 2% below list price
- Most Active Price Band** $400,000 to $500,000 with average >100% Sales Ratio (Sellers market)
- Buyers Best Bet** Homes between $800,000 to $900,000, Quay, Sapperton and 3 bedroom properties
- Sellers Best Bet** Selling homes in Downtown, Fraserview, Queensborough, Uptown and up to 1 bedroom properties
**With minimum inventory of 10 in most instances